sklearnには「digits」という画像(数字)の学習データがあるそう。これを眺めてみる。
【書式】
sklearn.dataseets
データ=sklearn.datasets.load_digits()
【コード】
import sklearn.datasets
digits=sklearn.datasets.load_digits()
print("データの個数=",len(digits.images)) #データの個数
print("画像データ=",digits.images[0]) #0番目の画像データ
print("何の数字か=",digits.target[0]) #0番目の画像データが表す数字
print(type(digits))
print(type(digits.images))
print(type(digits.target))
【結果】
データの個数= 1797
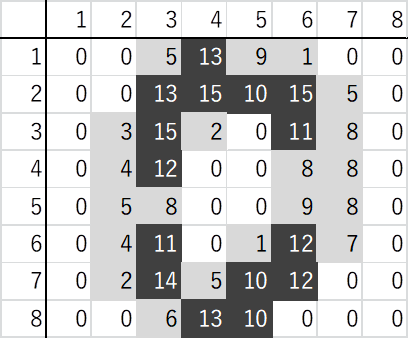
画像データ= [[ 0. 0. 5. 13. 9. 1. 0. 0.]
[ 0. 0. 13. 15. 10. 15. 5. 0.]
[ 0. 3. 15. 2. 0. 11. 8. 0.]
[ 0. 4. 12. 0. 0. 8. 8. 0.]
[ 0. 5. 8. 0. 0. 9. 8. 0.]
[ 0. 4. 11. 0. 1. 12. 7. 0.]
[ 0. 2. 14. 5. 10. 12. 0. 0.]
[ 0. 0. 6. 13. 10. 0. 0. 0.]]
何の数字か= 0
<class 'sklearn.utils._bunch.Bunch'>
<class 'numpy.ndarray'>
<class 'numpy.ndarray'>
画像データで返されている配列は、8x8のマトリックスで、その値は色の濃淡を表すらしい。0が白、16が黒、ということなので16階調グレースケールか?
とりあえず、10以上を黒い、1以上をグレー、0を白にして図にしてみると次のようになった。
【結果】
【書式】
【コード】
print("画像データ=",digits.images[1796])
print("何の数字か=",digits.target[1796])
【結果】
画像データ= [[ 0. 0. 10. 14. 8. 1. 0. 0.]
[ 0. 2. 16. 14. 6. 1. 0. 0.]
[ 0. 0. 15. 15. 8. 15. 0. 0.]
[ 0. 0. 5. 16. 16. 10. 0. 0.]
[ 0. 0. 12. 15. 15. 12. 0. 0.]
[ 0. 4. 16. 6. 4. 16. 6. 0.]
[ 0. 8. 16. 10. 8. 16. 8. 0.]
[ 0. 1. 8. 12. 14. 12. 1. 0.]]
何の数字か= 8
同様にマトリックスにおとすと

【書式】
plt.imshow()
cmapオプションで、登録済みのカラーマップを指定する。
【コード】
import sklearn.datasets
import matplotlib.pyplot as plt
digits=sklearn.datasets.load_digits()
print("最初の画像 ",digits.target[0])
plt.imshow(digits.images[0],cmap="Greys")
plt.show()
print("最後の画像 ",digits.target[1796])
plt.imshow(digits.images[1796],cmap="Greys")
plt.show()
【結果】
最初の画像 0

最後の画像 8

グレースケールが考慮されているので、手作業の図よりも情報量は増えたが、わかりにくくなったような気もする。
【書式】
forループで全体画像を作成して、最後に描画する感じ。
オプション
.subplot(縦,横,順番):「縦」x「横」のマトリックスの、「順番」番目に描画
.axis("off"):枠線を表示しない
【コード】
import sklearn.datasets
import matplotlib.pyplot as plt
digits=sklearn.datasets.load_digits()
for i in range(50):
plt.subplot(5,10,i+1)
plt.axis("off")
plt.title(digits.target[i])
plt.imshow(digits.images[i],cmap="Greys")
plt.show()
【結果】

もともと解像度が低いので、描画サイズが小さくなると判読しやすくなる。
【書式】
【コード】
import sklearn.datasets
import matplotlib.pyplot as plt
digits=sklearn.datasets.load_digits()
for i in range(100):
plt.subplot(5,20,i+1)
plt.axis("off")
plt.title(digits.target[i])
plt.imshow(digits.images[i],cmap="Greys")
plt.show()
【結果】
